Corporate Footprint and Environmental Stewardship
We are committed to reducing our environmental impact
At Leidos, we work every day to advance environmental sustainability for our customers and our own operations. Three of our key sustainability goals are focused on environmental stewardship.
- Reduce GHG emissions 25% by 2030
- Reduce waste by 50% in Leidos facilities by 2030
- Increase renewable energy to 25% of total electricity use by 2030
Our roadmap for achieving our climate action goals includes various solutions to reduce our environmental footprint, and we will continue to evolve our strategies as we continue our sustainability journey. Our near-term projects include:
- Real estate optimization: Utilize real estate effectively by disposing of underperforming or underutilized assets and implementing flexible workplace strategies.
- Energy efficiency: Reduce energy consumption by identifying and implementing energy efficiency upgrades to our facilities.
- Renewable energy: Increase utilization of renewable energy by exploring opportunities for onsite renewable generation, procuring renewable energy where available and purchasing Renewable Energy Certificates (RECs) from credible sources.
- Technology: Enhance technology and network support, including data center consolidation and upgrades to more energy efficient equipment and cloud migration, enabling greater workplace flexibility.
- Behavioral change: Increase engagement and collaboration, raise awareness, build capacity and recognize achievements.
- Education: Engage our employees in environmental sustainability and workplace behaviors that minimize waste and increase efficiency.
- Integration and innovation: Make sustainability a part of everyone’s job and encourage innovation and consideration across all businesses and functions.
- Circularity efforts: Collaborate with both our suppliers and our employees to implement circular measures within our business operations.
Footprint at a Glance
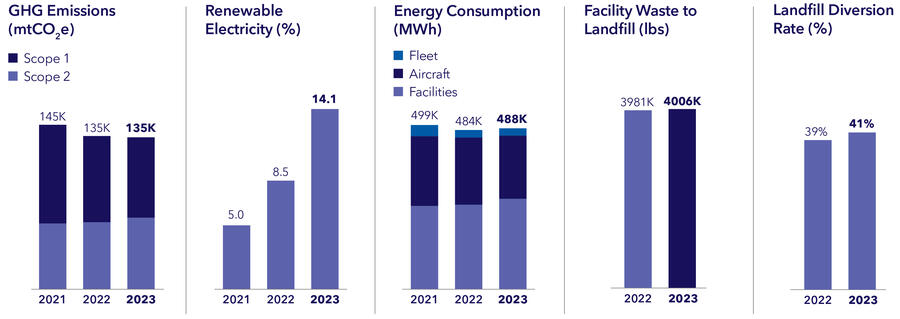
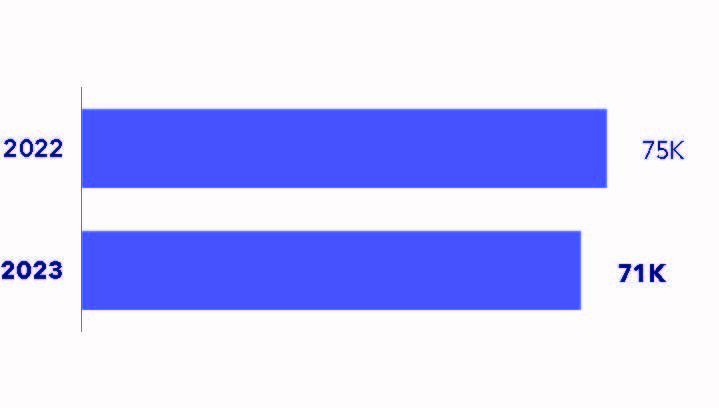
The charts below summarize our environmental performance history and include data from calendar years (CY) 2022 and 2023.
GHG Emissions
We are committed to playing our part to mitigate climate change through the work we do for our customers and by reducing our own emissions.
We quantify Scope 1, Scope 2 and select categories of Scope 3 emissions according to the GHG Protocol and by using industry-accepted emission factors. Our annual GHG inventories are third-party verified in accordance with ISO. View our assurance report here.
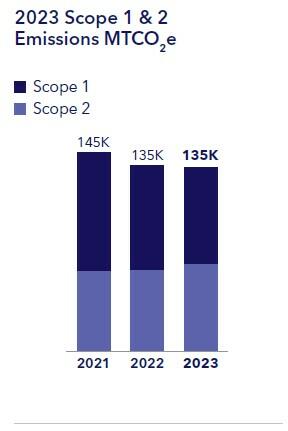
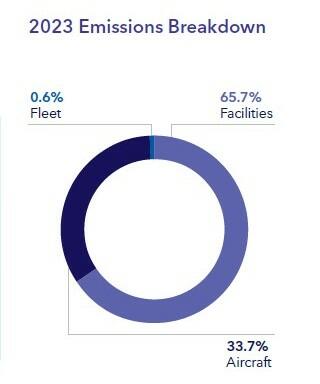
Leidos set a goal to reduce GHG emissions by 25% by 2030 relative to a 2021 baseline. In 2023, our overall Scope 1 and 2 emissions were 0.4% lower than 2022 and 7.1% lower than our 2021 baseline. Although we did decrease our facility emissions by 4% year over year, our aircraft emissions increased 7.7%.
Emissions
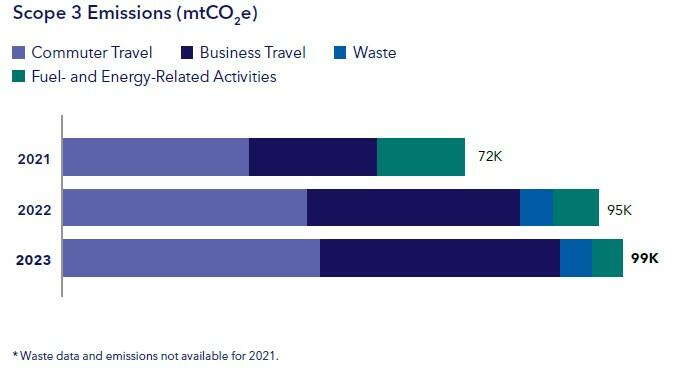
Leidos is improving and expanding data collection, measurement and analysis of Scope 3 GHG emissions. In 2017, Leidos began quantifying Scope 3 emissions from employee commuting and business travel. In 2021, we added emissions from contractor fleet and piloted/copiloted aircraft. In 2023, we added emissions from waste and incorporated emissions from a recent acquisition.
Our Scope 3 inventory enables us to better understand our environmental impacts and to identify opportunities to reduce our indirect emissions. Preliminarily, Scope 3 emissions increased by about 4% from 2022 to 2023; however, this change was largely driven by an acquisition in 2023. Business travel emissions from the acquired business are not available for 2022 but are included beginning in 2023. Excluding business travel, Scope 3 emissions decreased 1% year over year.
Employee commuting accounted for 46% of Scope 3 emissions in 2023 and increased 5% due to workforce growth. Business travel emissions accounted for 43% and increased 13% from our recent acquisition. These increases were countered by a 21% decrease in emissions from waste and Scope 3 aircraft and fleet fuels, which together accounted for 11% of Scope 3 emissions in 2023.
Energy
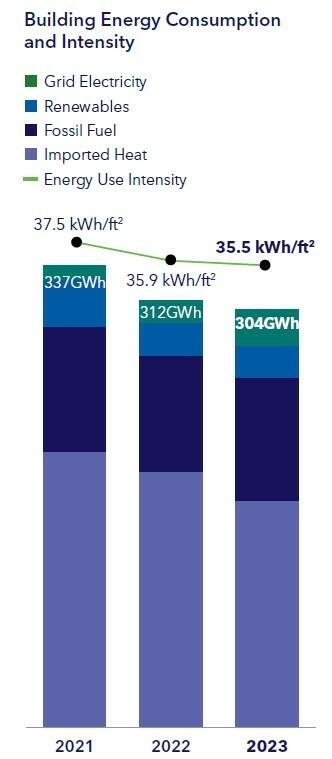
We continue to optimize our real estate portfolio and drive operational improvements to reduce our energy consumption and emissions. Key strategies include flexible workplace programs, disposal of underperforming or underutilized assets, energy audits and efficiency projects, standardized operating procedures and design practices, and renewable energy.
In 2023, Leidos buildings accounted for 62% of total energy consumption. We were able to decrease our energy usage by 2.5% year over year primarily because of real estate reductions and efficiency gains. From 2022 to 2023, total floor area decreased 1.4% and energy use intensity decreased 1.1%.
Our Strategic Energy Management Plan aligns energy efficiency with our goals to achieve
long-term benefits. This includes tracking and monitoring our energy variance across our portfolio and conducting renewable energy assessments at select facilities and energy audits of our largest and most energy-intensive facilities.
To date, we have completed 12 energy audits resulting in more than 150 energy projects and a list of energy best practices. These projects included adding occupancy sensors in offices and conference rooms and switching to LED lighting. Over the next five years, we intend to conduct deep dive assessments on major facilities, with the aim of addressing energy at 20 major sites that account for 80% of our total energy consumption.
We are committed to providing both internal and external communication on our environmental management strategies, progress and services.
Renewable Energy
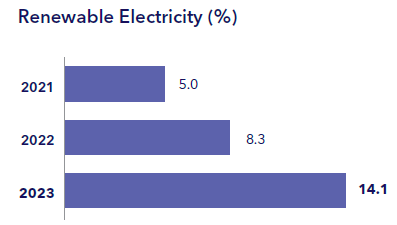
We set a goal to increase renewable energy utilization to at least 25% of total electricity by 2030. After procuring renewable energy at 11 facilities in Maryland in 2022, we continue to source renewable energy in California and increased our renewables in the U.K. in 2023. Leidos has now achieved 14.1% renewable electricity globally. We continue to explore new opportunities to increase renewables with preference for local sources of renewable generation.
Waste Reduction and Landfill Diversion
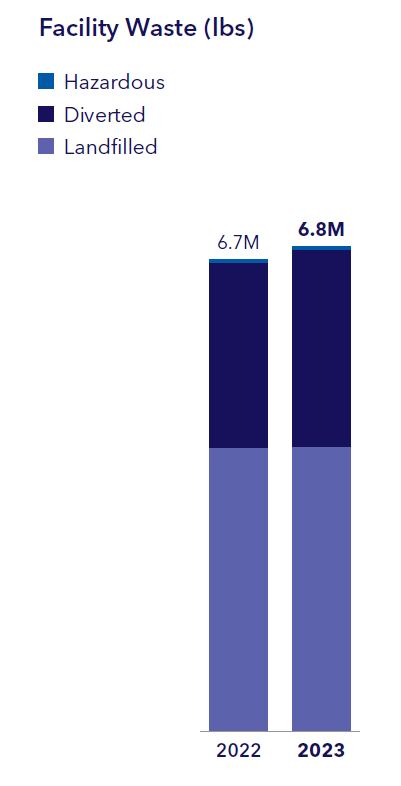
Leidos continuously strives to reduce our resource consumption and minimize our waste footprint. We set a 2030 target to reduce landfilled waste from facilities by at least 50%. In 2023, total facility waste and landfilled waste increased marginally. The increase in total waste was countered by a small increase in diversion rate from 40.2% to 40.4%.
Collecting waste data remains a challenge, but we continue to expand data coverage and quality. In 2023, landfill data was available for about 40% of our real estate footprint. We are working with landlords, waste haulers and recyclers to increase that number over time. We are also working to replace volume-based waste estimates with measured volumes and weights. For example, trash is weighed and logged before going into the dumpster at our global headquarters. These types of solutions are critical for developing high-quality data to support decision-making and measure progress toward waste reduction goals.
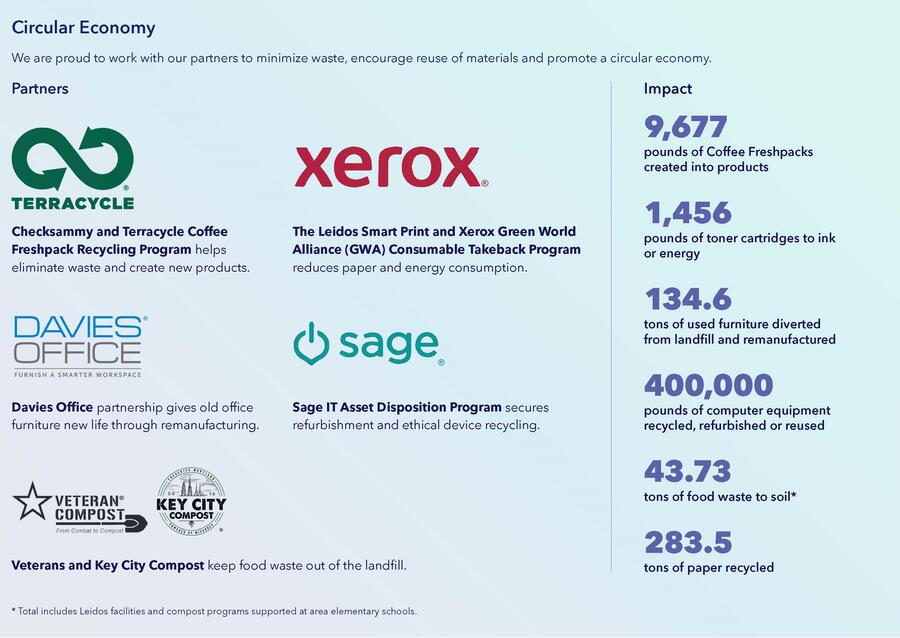
Leidos understands that our value chain is one of the largest sources of impact on the environment and that we have an opportunity to both learn and benefit from our suppliers innovations in waste reduction and circularity.
Water Stewardship
We have identified both Water Stewardship and Biodiversity as issues to watch on our ESG materiality matrix. At Leidos, our water usage is mostly limited to typical commercial office consumption, which does not currently have a significant effect on national or local water sources. We monitor our water use where we have access to bill data, or about 35% of our real estate footprint. We work to reduce consumption through water-efficient technologies, especially in water-sensitive climates like California and Florida. These include rain sensors for landscape irrigation, low-flow and sensor-activated fixtures, and reduced flush times.
* Data covers 35% of real estate floor area.
